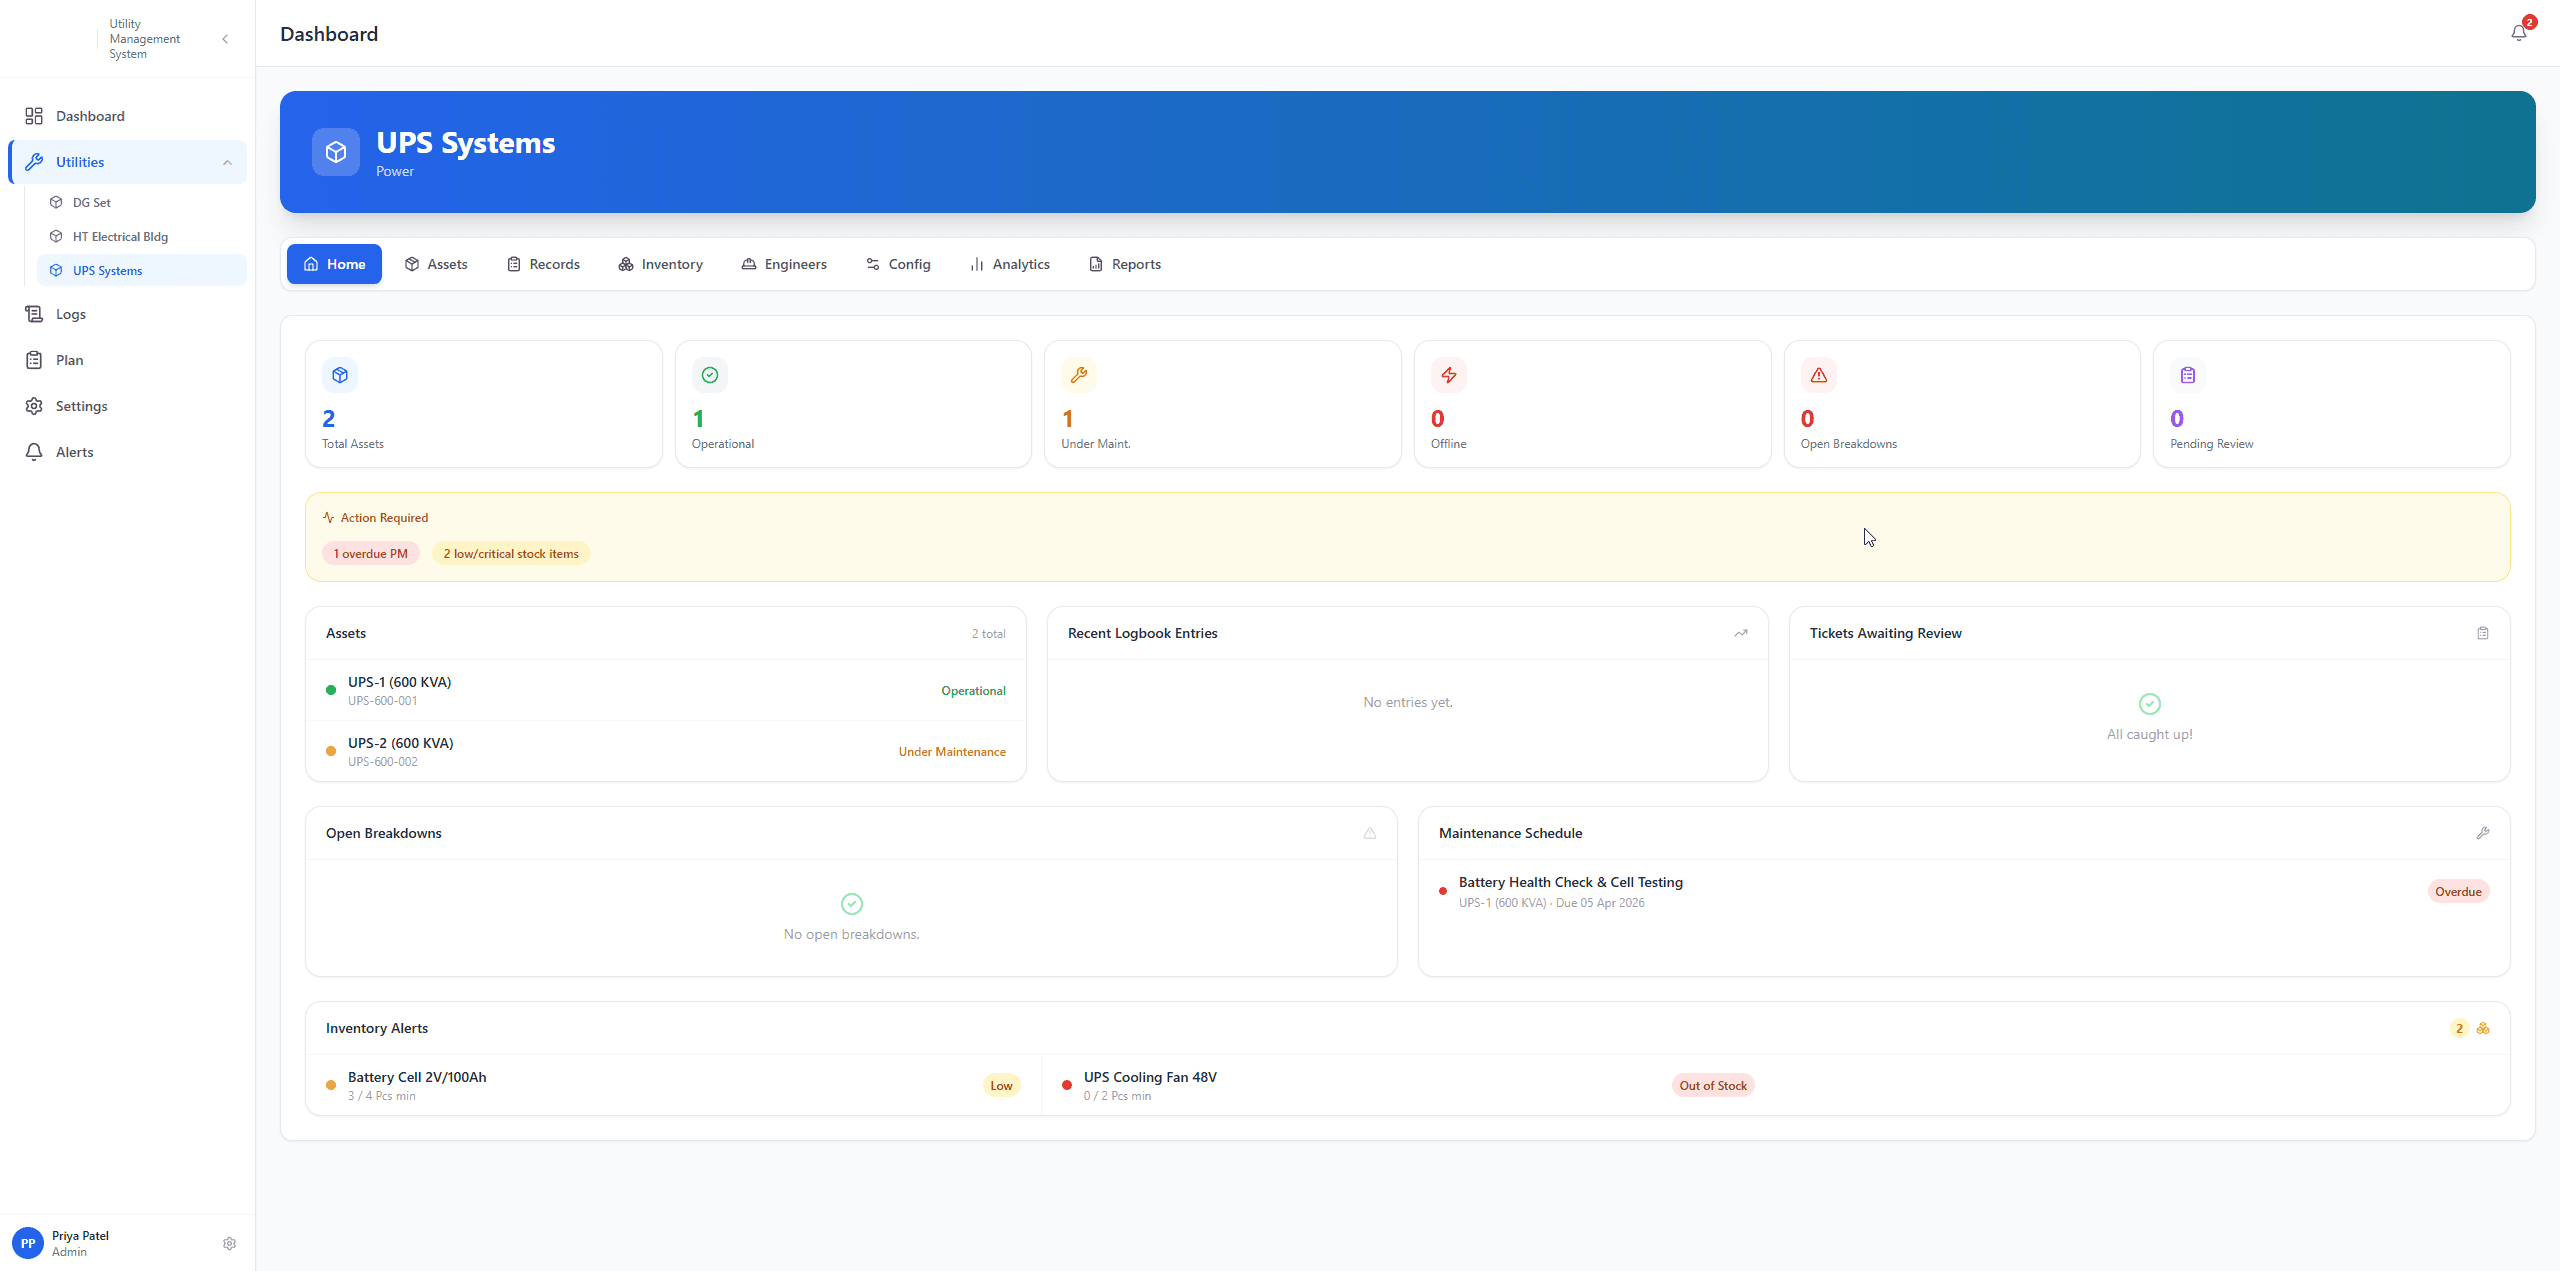
RaiseMattersIndustrial
Request a DemoProduct Brief

Deployed at Adani Defence Systems and Technologies Ltd.

Your factory runs on utilities.Now you can actually see them.

Real-time utility monitoring, complaint tracking, preventive maintenance, and breakdown management across every utility in your plant. Deployed in weeks.

13+ Utility TypesOn-Premise ReadyLive at Adani Defence
ums.raisematters.in / dashboard

Plant Overview

Morning shift · 06:00 – 14:00

Live
Power

1,284 kW

−3.2% vs yesterday

Water

42.1 KL/h

+0.8% vs yesterday

Compressed Air

6.8 bar

Normal vs yesterday

Open Tickets

3

2 critical vs yesterday

Power consumption (kW)

Last 8 hours

Recent alerts

Compressor C-2 pressure low

2m ago

Cooling tower flow nominal

18m ago

Boiler #1 efficiency dip

1h ago

Platform

One platform. Every utility in your factory.

Utility Monitoring

Shift-by-shift consumption entry. Automatic KPI calculation. Real-time anomaly alerts before excess compounds across days.

Power

1,284 kW

−3.2%

Water

42.1 KL

+0.8%

Compressed Air

6.8 bar

Normal

13+Utility types

Complaint Management

Any employee raises a complaint. Auto-assigned. Auto-escalated. Tracked to closure.

Preventive Maintenance

Digital checksheets. Mandatory deviation capture. Adherence tracking across every utility.

Breakdown & Spares

Component-level tracking. Spares cost capture. MTTR and MTBF built in from day one.

Breakdown history — Compressor C-2

Bearing3.2 h₹4,200Resolved
Belt drive1.4 h₹980Resolved
Pressure valveOpen
MTTRBuilt-in tracking
CompressorDryerChillerHT ElectricalHT FactoryUPSDiesel GeneratorDiesel & PetrolEnergy MeterETP & STPNitrogen PlantROWater ConsumptionCompressorDryerChillerHT ElectricalHT FactoryUPSDiesel GeneratorDiesel & PetrolEnergy MeterETP & STPNitrogen PlantROWater Consumption

New utility types added through configuration. No code. No waiting.

Process

How it works

1

Operator logs reading on shared tablet

Each operator has a unique login. Shift-locked submissions — no backdating, no guessing.

Shift-locked data entry
2

KPIs calculated instantly on submission

Specific Energy, Power Factor, COP, Flow Rate — derived automatically the moment data is saved.

Zero manual formulas
3

Anomalies flagged, alerts dispatched

Readings outside safe thresholds trigger instant alerts to the right people — no polling, no delays.

Real-time escalation
4

Reports routed through approval chain

Shift supervisors, plant heads, and energy managers each see exactly what they need to act.

Role-based visibility
5

Leadership dashboard updated live

No waiting for morning emails. The consolidated plant view refreshes the moment data is submitted.

Always current

The problem today

Paper logs nobody reads until something fails.

Breakdowns reported on WhatsApp with no trail.

Spare parts consumed without a single record.

Leadership gets answers two weeks late.

Rs 0L+

Average annual waste from untracked utility operations in a mid-size factory.

Built for India

Built for how your factory actually works

Shift-based data entry

Shared tablets, individual operator logins, shift-locked submissions. Designed for the shop floor, not the corner office.

Login scopePer operator
Entry windowShift-locked
DeviceShared tablet

On-premise or cloud

Runs on your servers for complete data sovereignty. Or on the cloud for flexibility. Same product, your infrastructure.

DeploymentOn-prem / Cloud
Data residencyYour servers

Configuration, not customization

New utility types, forms, KPIs, workflows, and alerts through admin UI in hours. No code changes. No developer dependency.

Change timeHours, not weeks
Code requiredNone

Audit-ready from day one

Every reading has an owner. Every ticket has a trail. Timestamped, approval-chained, exportable. ISO 14001, ISO 50001 covered.

StandardsISO 14001, 50001
TrailTimestamped
Before vs After

What your leadership sees today vs. what they could see

Today

Utility_Report_March.xlsx
Shift 1
Shift 2
Shift 3
Variance
Compressor
142 kWh
138 kWh
-2.8%
DG Set
38 L
41 L
+7.9%
Chiller
0.31
0.34
0.30
+9.7%
ETP
12 kL
11 kL
13 kL
Water
48 kL
51 kL
UPS
8 kWh
9 kWh
8 kWh
+0%
Sheet1Last saved: 3 days ago

With UMS

Live

Power Factor

0.96

Fuel Rate

0.31 L/kWh

PM Adherence

0%

Open Tickets

0

Consumption Trend (7 Days)

Active Alerts

3

DG Set 3

Fuel 14% above threshold

Chiller 1

COP below rated value

Complaint #247

Auto-escalated to manager

Updated just now
All systems reporting
Results

The numbers behind UMS

Up to

0%

Energy cost reduction

Anomaly detection catches excess consumption within the same shift — before it compounds across days.

Up to

0%

Downtime reduction

Component-level failure history enables preventive action instead of emergency response.

Up to

0%

Manual reporting eliminated

Shift and daily reports auto-generated the moment readings are submitted. No Excel. No lag.

Under

0 year

Payback period

For mid-size facilities managing multiple utility types across buildings, based on energy savings and breakdown reduction.

Calculate your savings

Annual utility expenditure

Rs 200 Lakhs

Rs 50LRs 10 Cr

Number of utility types

7 types

1 type20 types

Number of operators

25 people

5 people100 people

Projected annual saving

Rs 24L
Payback period1 months
3-year cumulative benefitRs 72L
Annual platform costRs 8–12L

Deployed at

Adani Defence Systems and Technologies Ltd., Kanpur

"Replacing paper-based utility operations with a single digital platform across the entire factory."

ISO 14001
ISO 50001
ISO 55001
FSSAI Ready
Pollution Board
Audit Ready
Case Study
Adani Group

Driving energy efficiency and ESG compliance at Adani Defence Systems and Technologies Ltd., Kanpur

Adani Defence replaced paper-based utility operations across their Kanpur defence manufacturing facility with UMS — achieving real-time visibility into 13+ utility types, eliminating manual reporting lag, and building a fully digital audit trail aligned to their sustainability and ESG commitments.

11%Reduction in energy consumption in Year 1
ISO 14001Environmental Management — audit-ready from day one
100%Digital audit trail across all utility operations
ISO 50001ISO 14001Zero PaperESG Aligned

Your utilities are running right now. Do you know how they are performing?

Typical deployment: 2–4 weeks. No infrastructure changes required.